
Insider Risk: A Cybersecurity Threat Least Talked About in The Industry
07/30/2021
How a 26 Year Old Started a SaaS Company and Sold It For 7 Figures At The Age Of 30
09/10/2021Postalytics: Improve Conversion Rate by 25% to Website In 4 Months [Case Study]
Executive Summary
Over the course of a 12 month period and after completing our initial comprehensive audit with the Postalytics team, we worked on and improved the following :
- We started to improve conversion rate to the website by testing new designs and adding Call to actions based on a data driven marketing approach. We yielded a 29% increase in number of leads over 4 months
- We optimized the chatbot to increase engagement and increase conversion from sign-up to credit card details entered in the checkout process. We tripled the conversion rate from 12% to 34% in 6 weeks.
- We launched and optimized a new Paid social media ads campaign and sales funnel. We increased new users sign-up by 56% over a 5 month period and decreased the cost per acquisition by 47% over the same period.
About Postalytics
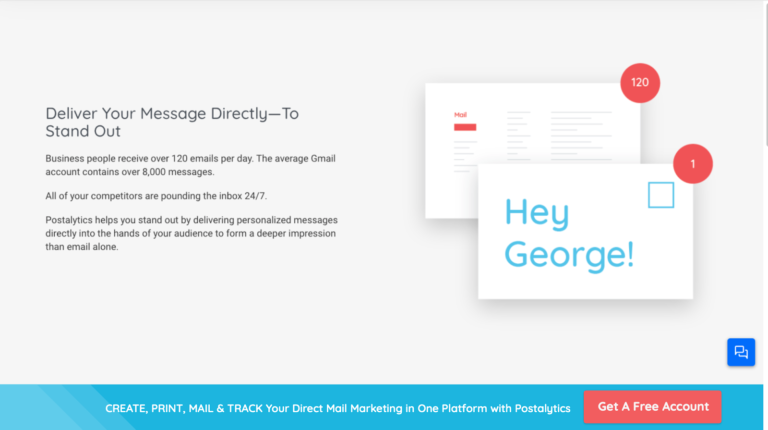
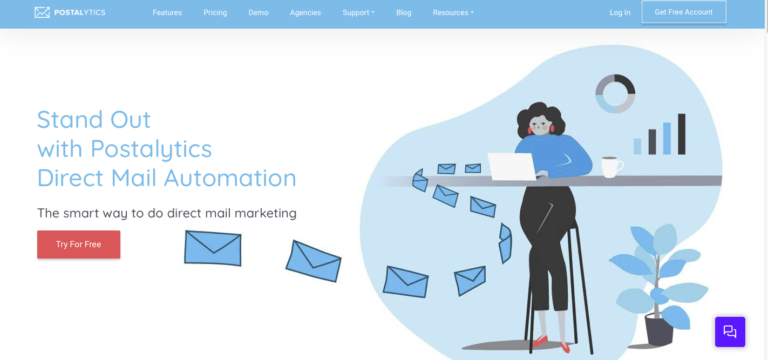
Postalytics is a direct mail marketing automation B2B SaaS platform that offers tech savvy marketers a new channel of marketing that’s easy to send, fast, trackable and integrates with your tech stack, in order to stand apart from overflowing e-mail marketing.
Goal of Growth Marketing Partnership With Postalytics
HoriZen Capital partnered with Postalytics to drive more free customer accounts, which would lead to an increase in sales conversion rate and revenue from sending more mail pieces as well as more paid user subscriptions and Monthly Recurring Revenue to the B2B SaaS company, thus improving the entire sales process and conversion funnel.
Initial Audit and Hypothesis
After auditing the website, landing page, product page and entire sales funnel, we generated the lists of conversion rate optimisation tests we wanted to run. Our hypothesis going into this growth marketer experiment was that we would increase conversions by at least 20%:
Site-wide Conversion Optimization:
– Add sticky/floating CTAs with optimized copy on mobile so customers can always see and access a call-to-action button wherever they are on the page and on the website.
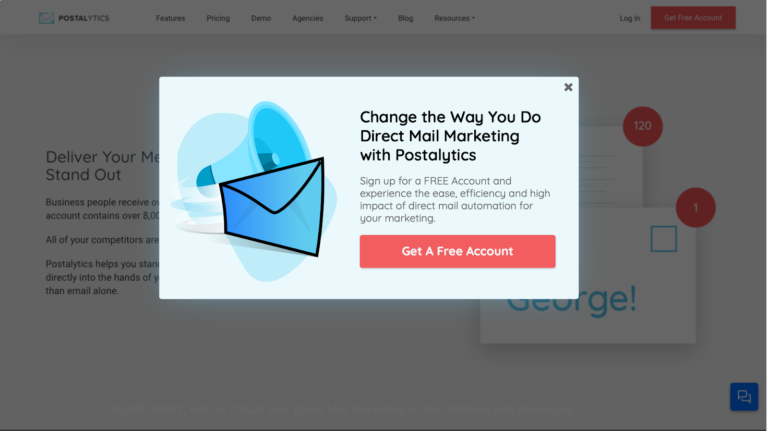
– Add an exit intent popup CTA. This is effective in converting users who are about to leave your website but have not yet converted.
– Optimize the form on mobile to improve conversion rate by making it easier for users to fill it out.
– Test exclusivity, scarcity, and social proof strategies.
For Homepage:
– Header Optimization: Redesign header to include the following elements: One-line description of the service, top benefits and features, a good image, credibility badges and/or testimonials, and a clear, high-contrast call-to-action button. The header should be optimized for all device types.
– Include top reviews in the Header and an anchor link to the review section.
Pricing Page Optimizations:
– Make the CTA button more prominent and visible above the fold.
– Add brief copy/ summary for each plan based on the main value metric so users can easily compare them.
– Add credibility badges near CTA buttons and / or testimonials to reduce possible friction points.
– Highlight a recommended plan by adding badges (eg. Best Value, Most Recommended, Best Selling Plan).
– Display contact details (eg. phone number, contact form) more prominently so interested users will have the option to get in touch.
– Rearrange features and benefits such that the main value metric will be most visible.
For Blog Post Pages:
– Display contact details (eg. phone number, contact form) more prominently so interested users will have the option to get in touch on desktop.
– Add a sticky CTA on the sidebar.
About Our Conversion Rate Optimization Test Process
Each test normally run for about two weeks or until we get statistical significance. We tracked conversion rates with VWO throughout the duration of the tests. There’s no changes made to any of the test pages to preserve the integrity of the data. If any changes are made, we normally have to restart the tests.
We divide the traffic into two where 50% of the traffic will be able to view the original design (control pages) and the other 50% will see the new pages (variation pages).mpr
The first thing we did was run an audit on the website visitor traffic to explore opportunities to generate a good conversion rate before starting a campaign to drive additional traffic, otherwise leading to waste in ad spend.
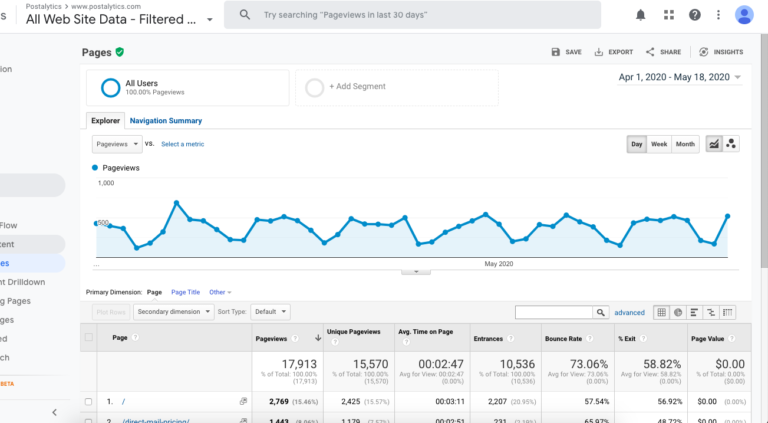
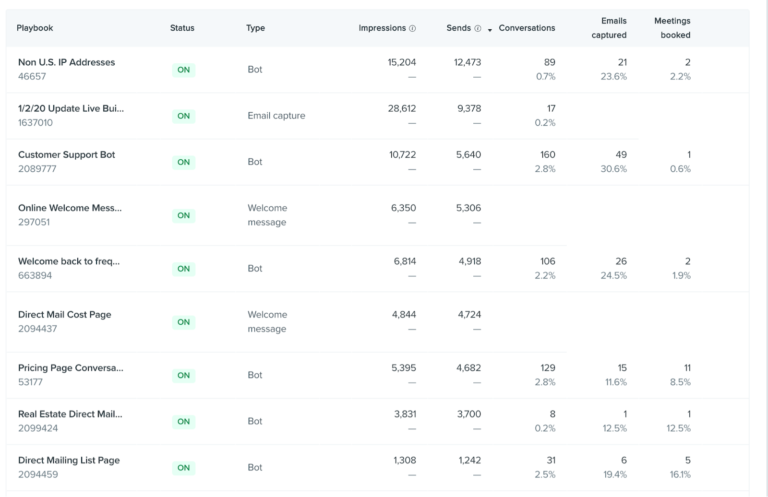
We analyzed the top 10 pages on the website that received the most traffic in Google Analytics:
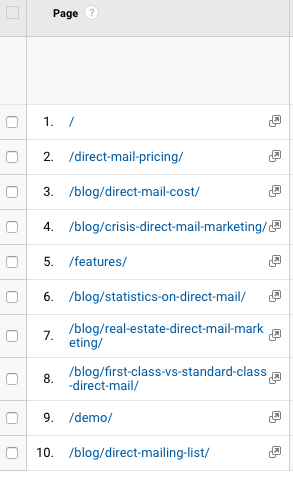
We understood that the current average conversion rate of the site to be about 2.5-3% of site visitors converting to free user accounts.
Total amount of traffic to the website in the last 45 days:
First Set of CRO Tests
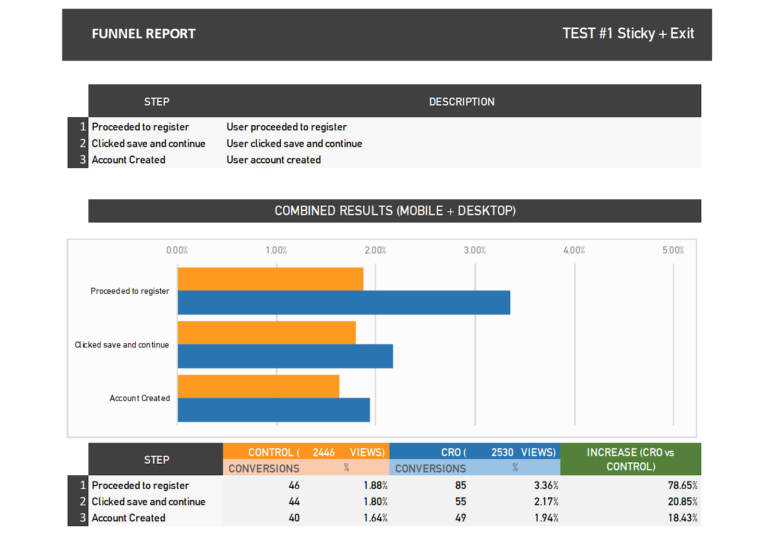
#1 Added an Exit-intent popup
#2 Site-wide sticky CTA
Results Of Experiment #1
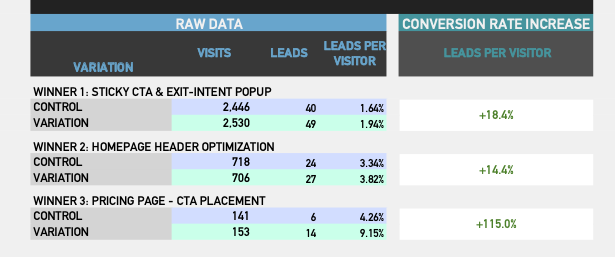
Net average increase of 18.43% of new free user accounts created for both Mobile (14.52%) and Desktop (19.18%). Win!
Second Set of CRO Tests
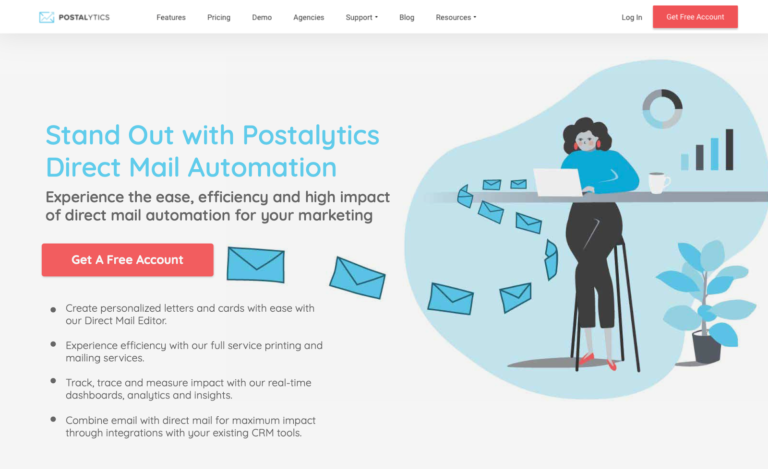
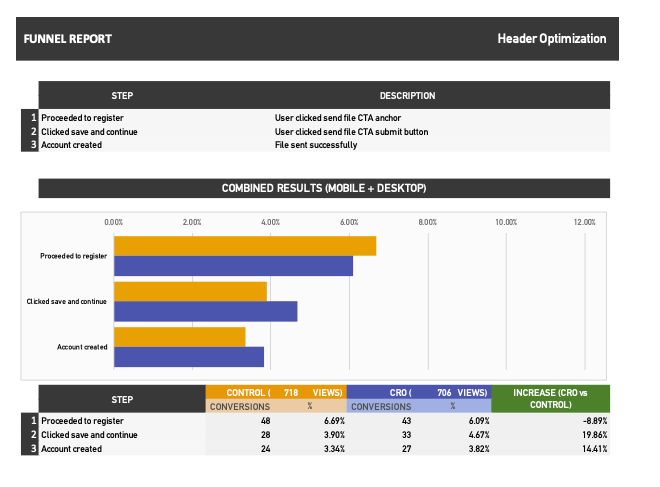
#1 Homepage Header Redesign
Original Control
Variation
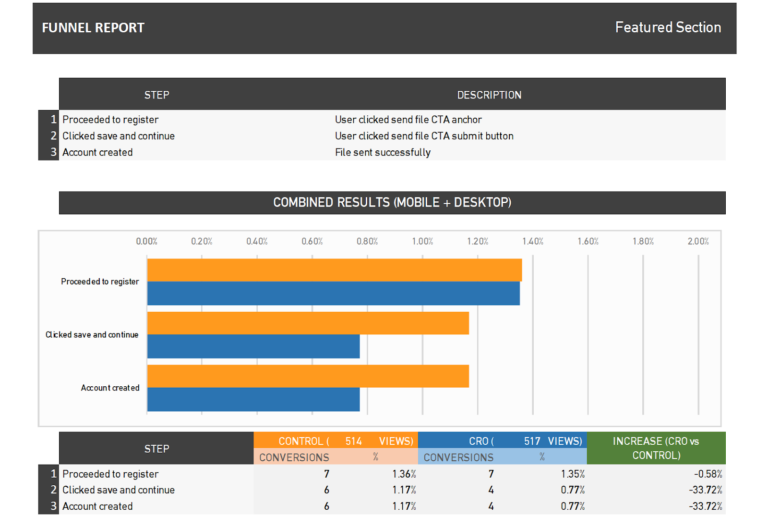
#2 Featured Section on Top Blog Posts
Results of Experiment #2
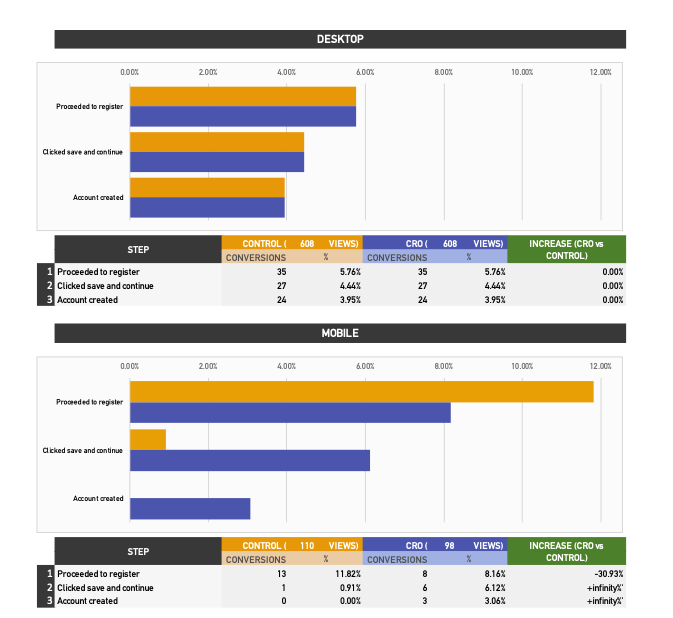
After running the homepage header tests for 37 days, our design had a higher conversion rate (signups) by 14.41%, with a 97% confidence level. However, we rolled out the new variation for Mobile only as there wasn’t any improvement on the Desktop test.
Surprisingly, the Featured section test was disappointing, leading to a decrease in conversions by 33.7%.
Third Set of CRO Tests
Registration page at: https://app.postalytics.com/register/
We broke the test into separate experiments. One for the design element by adding an optimized headline, features and benefits copy about the service, a relevant image, and a good review to further inform and encourage users to signup.
Original Design
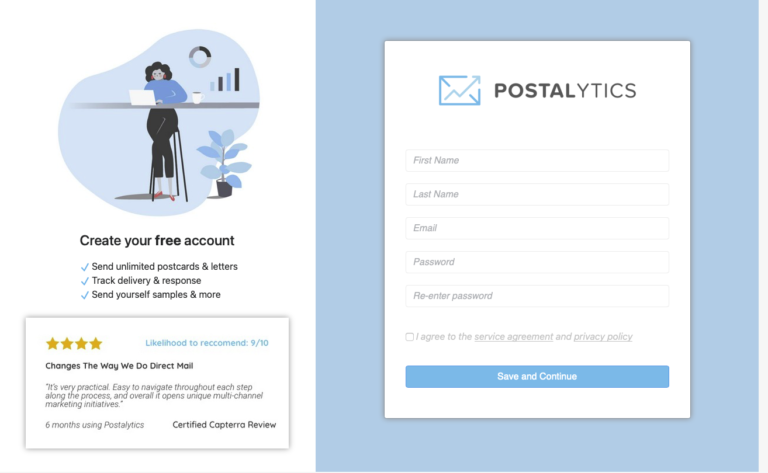
Variation #1
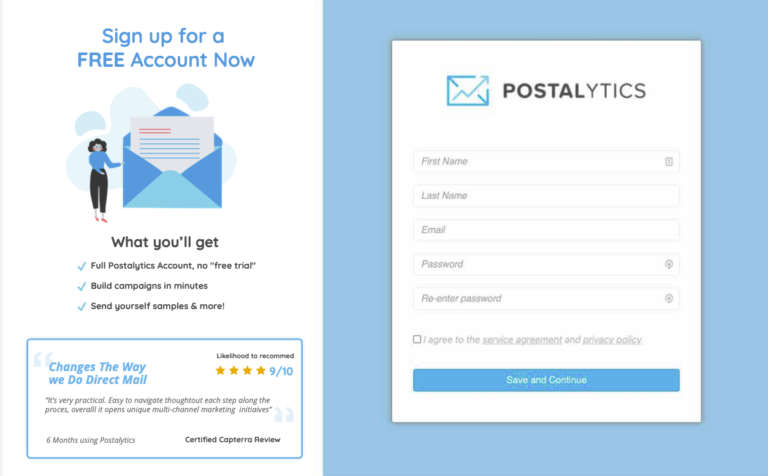
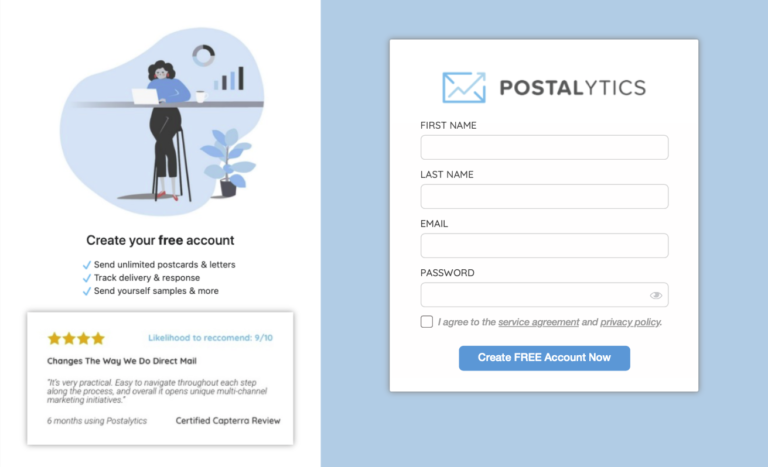
Variation #2:

#2 Testing around the form section only, that included:
-Placing the labels on top of the fields.
-Removing the “Re-enter password” field and placing a hide/view password feature.
-Changing the CTA button copy to make it clearer and highlight the free service.
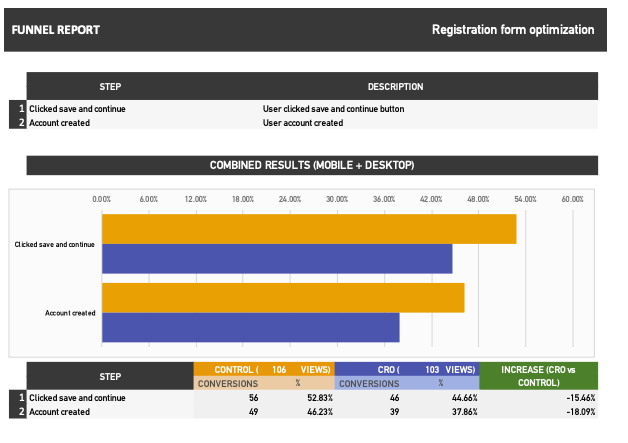
Results of Experiment #3
The original design has outperformed the variation by 1.1% on Desktop but we saw an increase on the Mobile conversion. Original design of the registration forms (surprisingly) has outperformed the variation by 18.01% so we failed on this experiment.
Fourth Set of CRO Tests
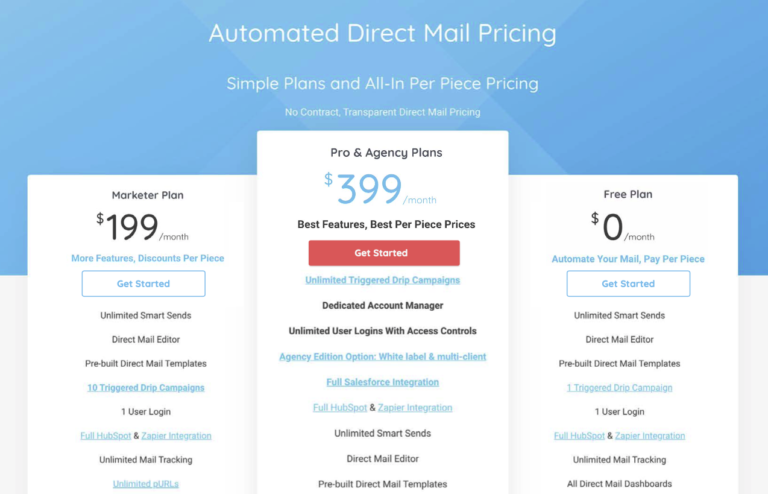
Final tests were on the Pricing Page: https://www.postalytics.com/direct-mail-pricing/
#1 Placing CTA buttons above the fold on each of the pricing packages as users had to scroll to the bottom of the package to be able to sign up.
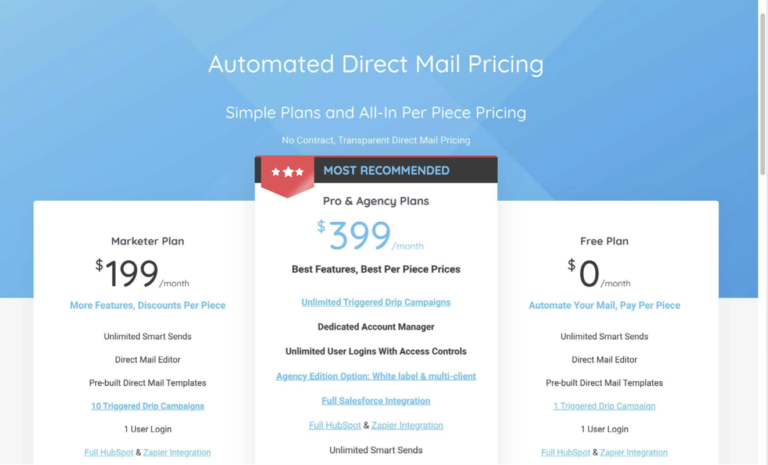
#2 Add a ‘Most Recommended’ Badge on the Pro & Agency Plan to make it stand out more relative to the other plans.
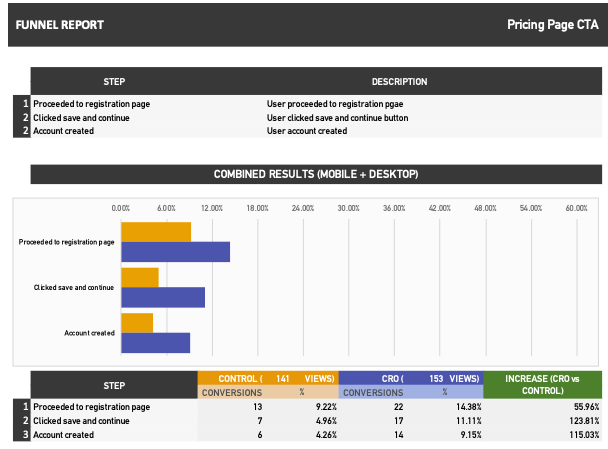
Results of Experiment #4
The tests on the Pricing Page CTA button optimization increased the conversion rate (successful signups) by 115.03% with a 95% confidence level whereas adding the badge decreased the conversion rates by 10%.
Overall Results and Improvements Implemented From The Website CRO Campaign:
Only half of the experiments we ran were successful in increasing conversions. Overall, 3 of the tests were successful where 4 of the other tests we ran were failures – all part of a growth marketer approach.
As mentioned, our hypothesis going in was to increase the site’s conversion rate by 20%. We exceeded that conversion goal with an overall increase by over 25% combined!
Second Step: Drift Conversational Marketing Campaign Optimization
We reviewed the messaging sequence for getting more leads interested in initiating the live chat by creating different messages to test and implement it one by one to allow time to see the results.
Goals of this campaign:
- Find qualified subscription clients. Drive qualified target audience to a sales call if they are ready, and drive non-qualified toward the free account.
- Separate existing accounts in need of tech support from prospects who want information to help make their decision about Postalytics.
- Improve email capture.
- Improve live chat acceptance rate.
These were the list of all the existing campaigns in Drift based on different pages and users coming to the website:
Few of the Messages We Tested
Improve Pricing page message
From:
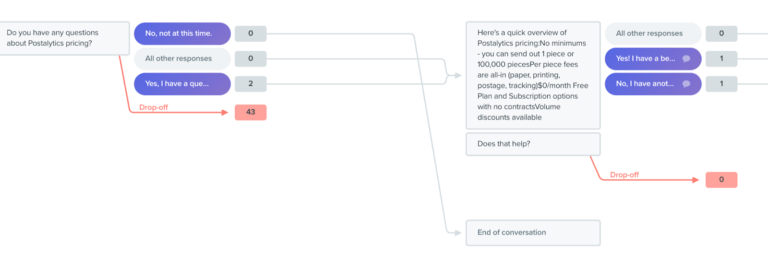
To:
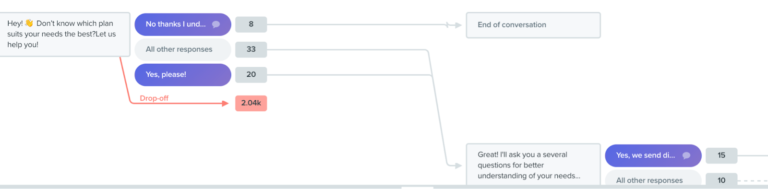
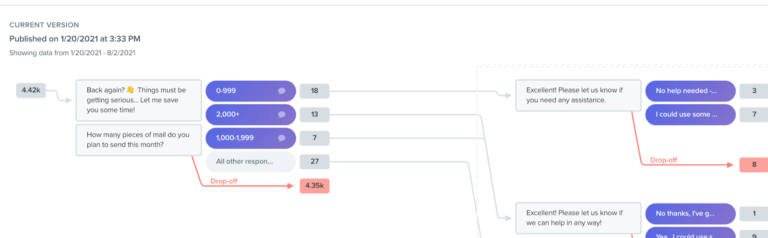
Improve & personalize welcome messages to the website
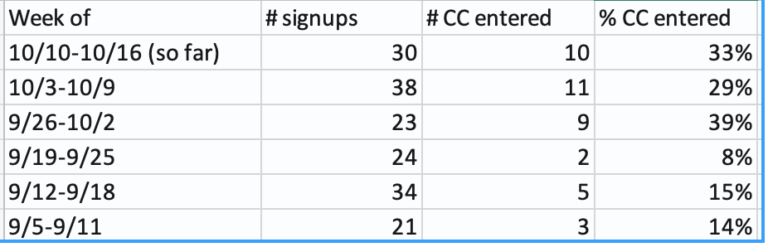
Results of Drift Optimization
We can see that the number of Credit Card entries has almost tripled. On average from 12% in the first 3 weeks of original messaging to 34% in last 3 weeks!
Third Step: Launch a Scalable Paid Campaign
Goal: Drive more qualified traffic and free user sign ups as part of the customer journey on the website as the main traffic source has been organic.
Hypothesis: Since all of Postalytics users are based in the USA, and the fact that Postalytics has never ran paid ads before, we did not have any initial data to work with. Aside from Organic marketing channels, we decided to build a model from scratch using similar conversion values.
Our monthly budget was $7000 per month to be split between Google Search, Display, Facebook with the following projections:

Expected CAC To LTV: With an estimated LTV of $15k per paid subscriber client, on a $7k/month ad budget, we were hoping to increase new paid monthly subscribers by at least 9, to exceed a 14:1 ratio of LTV to CAC. In general, any results above 3:1 is well worth it with a SaaS company and should be scalable.
Below are the results of the Google Search and Display ads we ran.
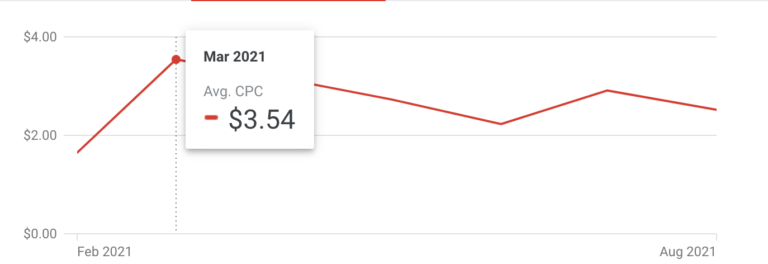
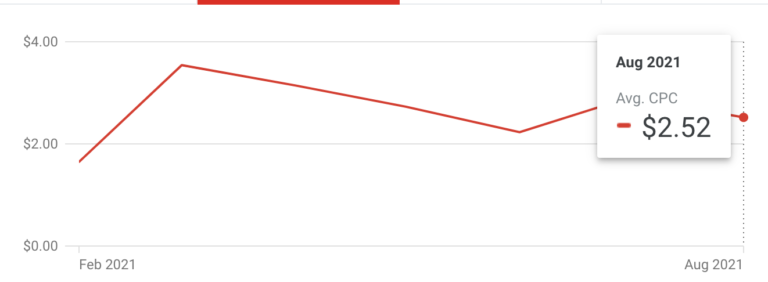
CPC: Decreased the average Cost Per Click from $3.54 to $2.52 (about 29% decrease) over a 5 month period.
March 2021
August 2021
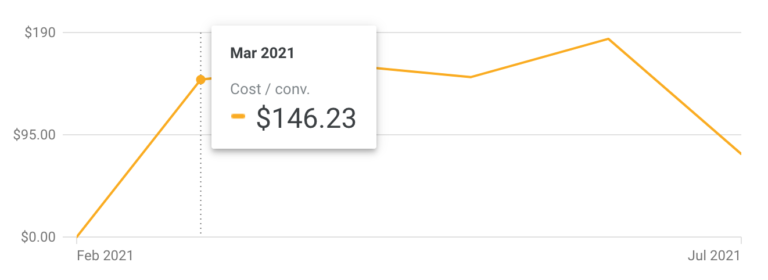
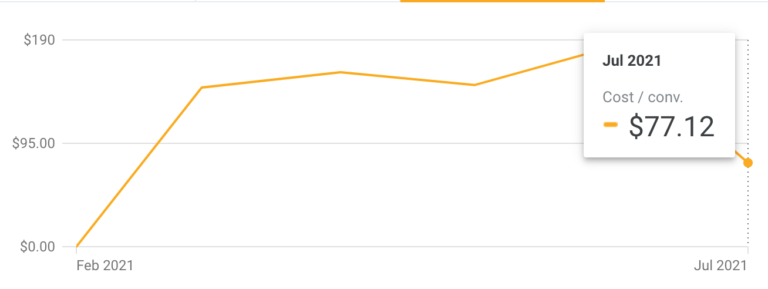
CPA (Cost Per Acquisition): Cost per new user conversion dropped from $146.25, which was slightly higher than our initial hypothesis ($137) to $77.12 per conversion (about 47% decreased over the 5 month period).
March 2021
July 2021
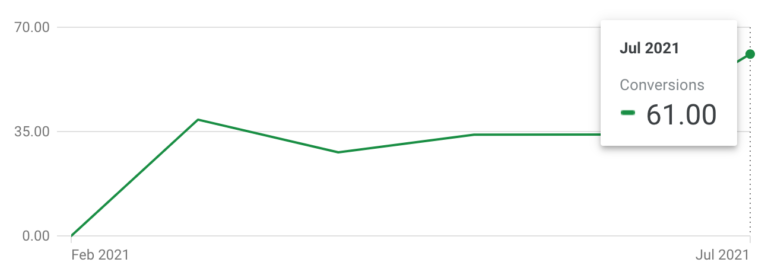
Number of Leads: Increased the number of new user sign ups from 39 per month to 61 per month (56% increase over a 5 month period).
March 2021
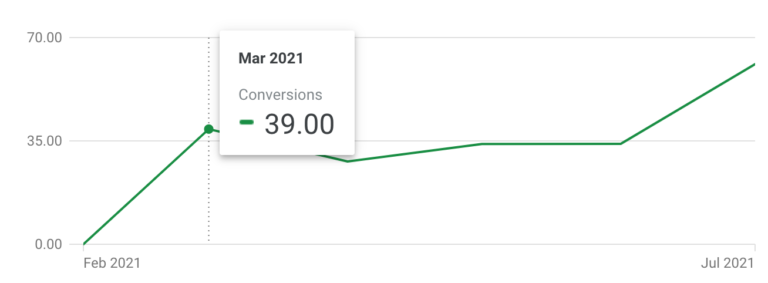
July 2021
Summary of Our Performance Results:
- We improved the website conversion rate traffic of existing traffic by 25% over a 4 month period
- Improved Credit Card entered by new user accounts by 3x within through Drift’s live chat optimization
- Decreased CPA through Google AdWords campaigns by 47% over a 5 month period
We still have a lot of work to continue to grow the business and have many further growth experiments to implement as we gather more data and understand the market better.
Here are is our growth roadmap of what we plan to focus on the remainder of 2021:
- Started LinkedIn Outreach lead generation Campaign (already showing promising results – stay posted for part 2 of this case study with results)
- Reduce CPA of paid ads to less then $70 and scale the budget
- Test other paid marketing channels including YouTube Ads
- Running Direct mail campaigns to existing lists. Using Postalytics own digital marketing platform!
- Building more PR of the site for SEO and content marketing purposes through guest podcasting on entrepreneurship, marketing, startup and SaaS podcast shows.
If you’re looking for a partner and similar results for your own SaaS company, check out our B2B SaaS consulting services to see if we’re a good fit to work together.


