Official Launch of HoriZen – Acquiring SaaS Companies
01/30/2020
General Partner at Horizen Capital previously worked with Wired Investors and this is a case study on the acquisition and growth of based on the execution and management period with 99 Dollar Social.
Background
We bought 99 Dollar Social in July 2016 and in this case study, we’ll show you what we did and the results thereof.
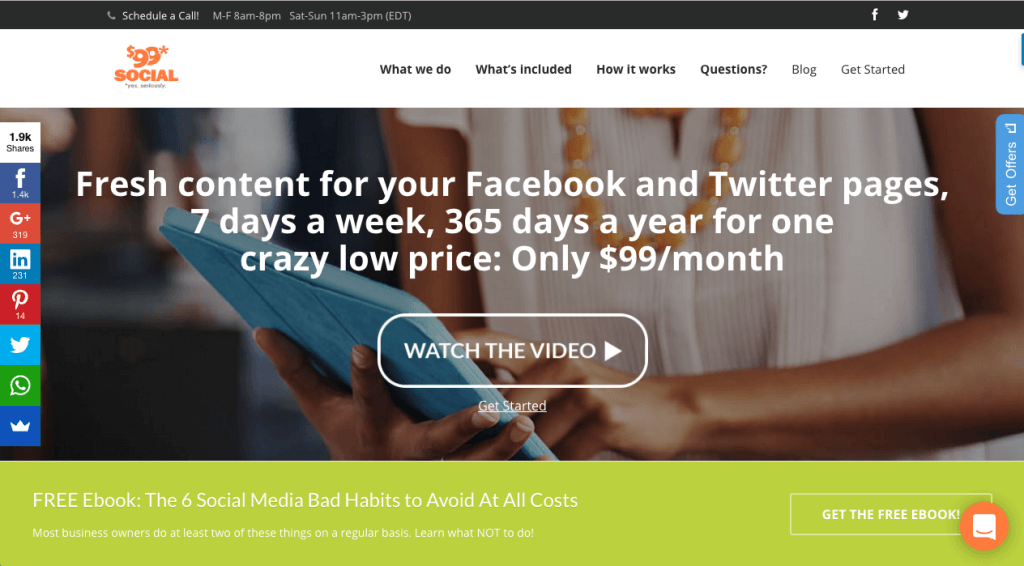
What is 99 Dollar Social?
Launched in 2014, 99 Dollar Social is a subscription marketing business that delivers fresh content for Facebook and Twitter pages for small businesses at $99/mo.
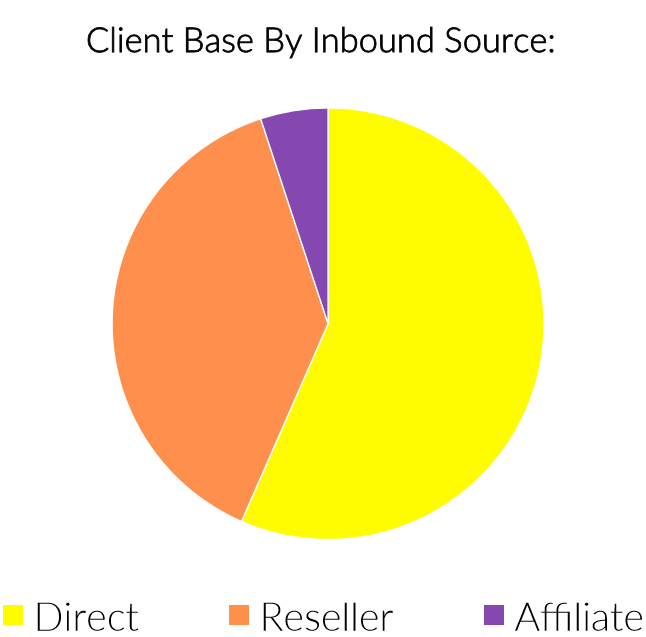
At the time of the acquisition, the site had 512 active customers and 2 main sales channels—direct retail (57%) and resellers (38%). Affiliates accounted for only 5% of our sales.
- Direct retail: The majority of our users came in directly to the site through organic rankings, publicity from media outlets/other sites or social media.
- Resellers: Another major chunk of our users came in through reseller partners (e.g. SEO agencies) who sold our services to their own customer bases.
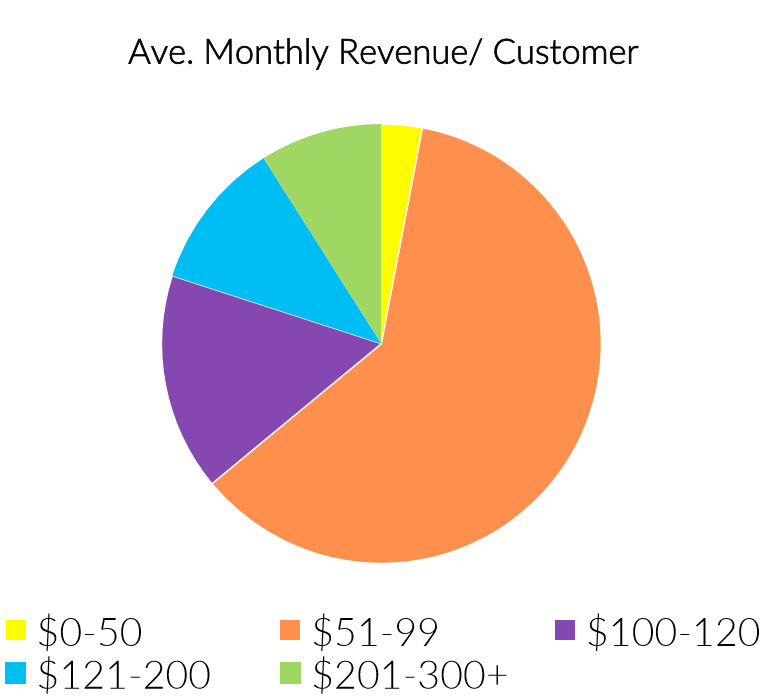
Here’s a look at the average monthly revenue per customer. 61% of them were in the $51-$99 range
Several factors that influenced us to buy the website were:
- Strong history of profits and growth. The site had a profitable core product with several upsells (LinkedIn/Pinterest add-ons had 100% profit margins)
- High gross margin of 78% thanks to scalable system and workforce and strong operating procedures
- Big marketplace for such services. The social media management market was a fragmented one with no clear leader and we saw an opportunity to build 99DS into the market leader
- Email list size of 10k
- Strategic fit with the rest of our website portfolio
The Risks
However, the site had its risks:
- High churn rate of approx 15%
- Many competitors (esp. offshore competitors who could undercut us in pricing)
- High copycat potential
- Reliance on social media APIs. If the various social media platforms changed their APIs, we’d have major work to do.
- Big team to manage. If team members left, we had to train and onboard new ones quickly.
Deal Structure
The site had grown profits steadily since it launched (see the chart below). It tripled its earnings in 1 year from $7k/mo in Apr 2015 to $24k/mo in Apr 2016.
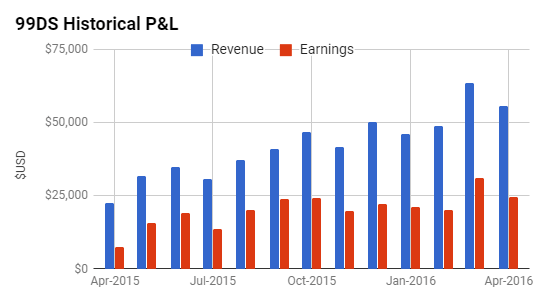
The site averaged $20k/mo in earnings the last 6 months before purchase (i.e. between Jan – Jun 2016). The last 12 months earnings was $255k.
Our short term goal was to 2x earnings within 1 year and our long term goal was to 4x the earnings in 3 years and exit the business after realizing those gains.
The Opportunities
We saw the opportunities as follows:
Short Term
- Split test pricing and user checkout
- Shift focus from direct retailer customers to resellers
- Partner with experts who have SEO agency audiences
- Set up a more comprehensive affiliate program
- Reduce customer service costs
- Monetize our email list via webinars
Long Term
- Reduce churn
- Add higher value add-on services
- Use paid traffic via Facebook ads
What We Focused On
We decided to hone in on the following based on our available resources:
- Further monetizing our reseller program via webinars
- Maximizing our existing affiliates’ lists
- Upselling to higher-tier plans
- Reducing churn
- Running paid ads on Facebook
- Experimenting with push notifications
- Creating content and link building
We only started to work on the site in July 2016 so we’ll focus on July/Aug 2016 to July/Aug 2017 in all the charts below.
I. Further Monetizing Our Reseller Program via Webinars
Our reseller program used to be free to join but that attracted looky-Lous. So we changed it to a structure where partners had to pay to join. This weeded out those who weren’t serious.
After joining, our reseller partners were allowed to white label our services i.e. our branding/logo would not be seen anywhere.
Resellers were free to set their own prices and use their own branding/logo with their own customers.
This program was great for those who were sales oriented and just wanted to manage client relationships without having to build/manage their own teams.
Because they didn’t have to do the actual social media postings themselves, it saved them valuable time.
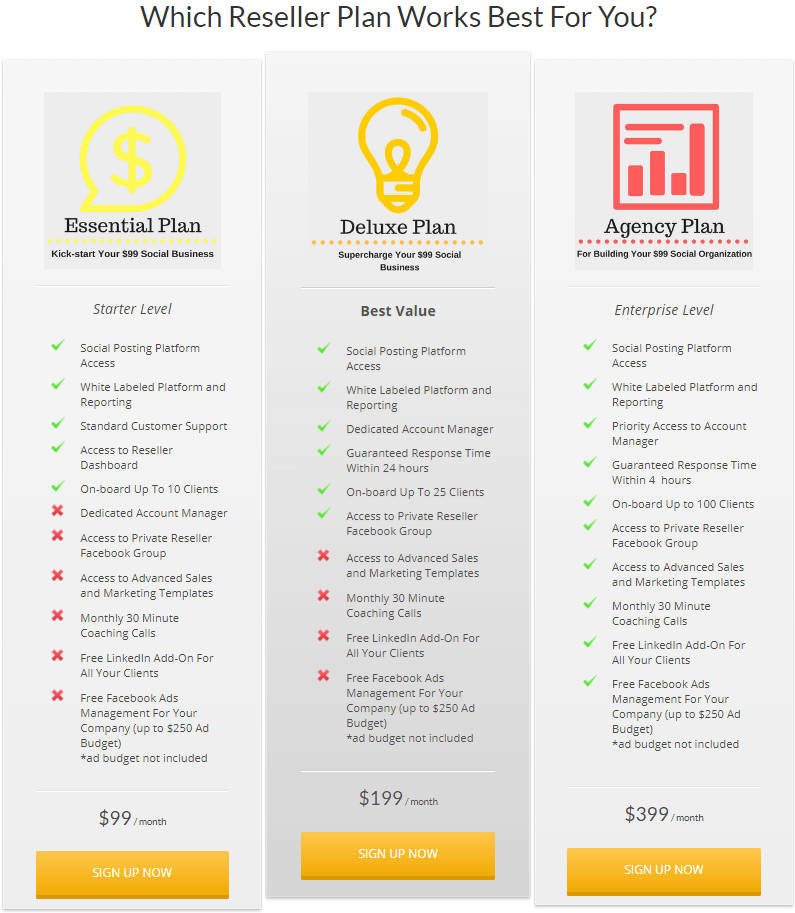
Resellers could pick from 3 different plans:
Resellers were roped in mostly through recorded webinars. We sent emails to our list asking subscribers to join our webinars every few days.
We also prepared a series of swipe emails which our affiliates could use to appeal to their subscribers to sign up for our webinars.
If they stayed till the end of the webinar, we offered them a lifetime $100 off coupon code to entice them to upgrade to the highest tier $399/mo plan.
Besides promotional webinars, we also ran training and education webinars every 2 weeks.
The Results
Since we took over, we increased the number of resellers by 1.7x, from 182 in Aug 2016 to 306 in mid-Aug 2017.
Note: The word “subscriber” in the chart below refers to customers.

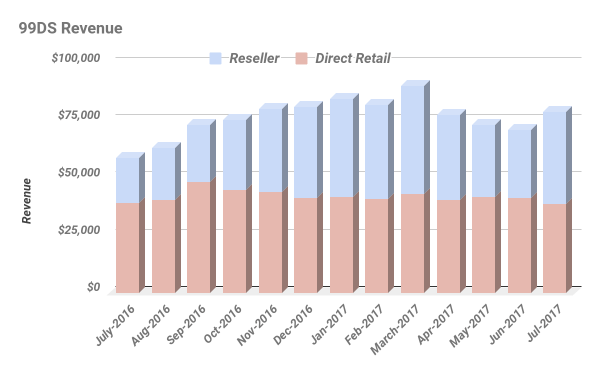
While revenue from direct retail customers hovered around $42k, revenue from resellers doubled from $19,743 in July 2016 to $40,092 in July 2017.
And the revenue from resellers increased from 34% to 51% of our total revenue.
Note: Affiliate revenue not shown because it was too insignificant.
II. Maximizing Our Existing Affiliates’ Lists
Our affiliates came in through salespeople who had relationships with them. We also had affiliates who reached out to us proactively.
So here’s how we cross-promoted 99DS to our affiliates’ lists:
We prepared a series of swipe emails which our affiliates could copy and paste. It consisted of 3 emails sent over 5 days.
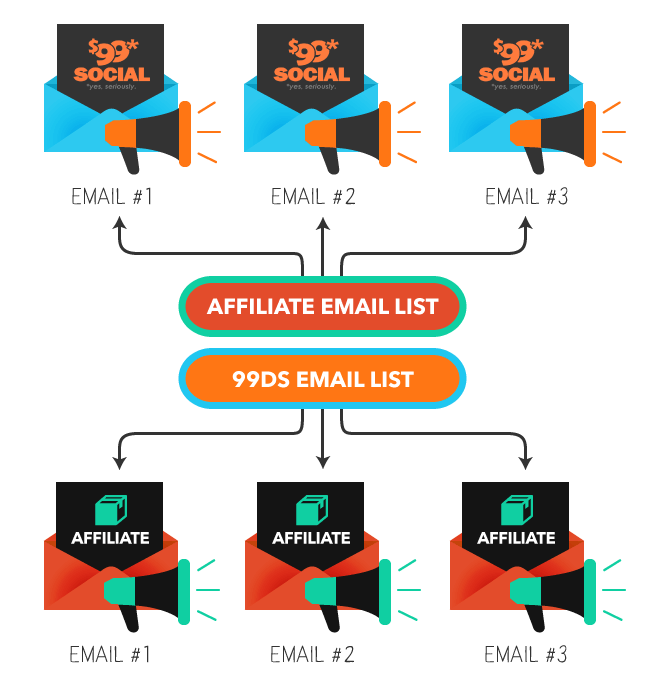
We sent 3 emails promoting 99DS to their lists and in return, they sent 3 emails promoting their products/services to ours. Our affiliates get paid 10% recurring revenue for each sale.
Moving forward, we might focus less on affiliates because they hadn’t proven to be highly profitable.
III. Upselling to Higher Tier Plans
Whenever possible, our customer service/live chat staff would recommend a mid/high tier plan. On our site, we also steered the choice towards the mid tier plan.

We also added more CTA options to upgrade plans in our email campaigns for new customers.
We followed up with a call 2 weeks after purchase to see how they liked the content and took that opportunity to see if we could upsell.
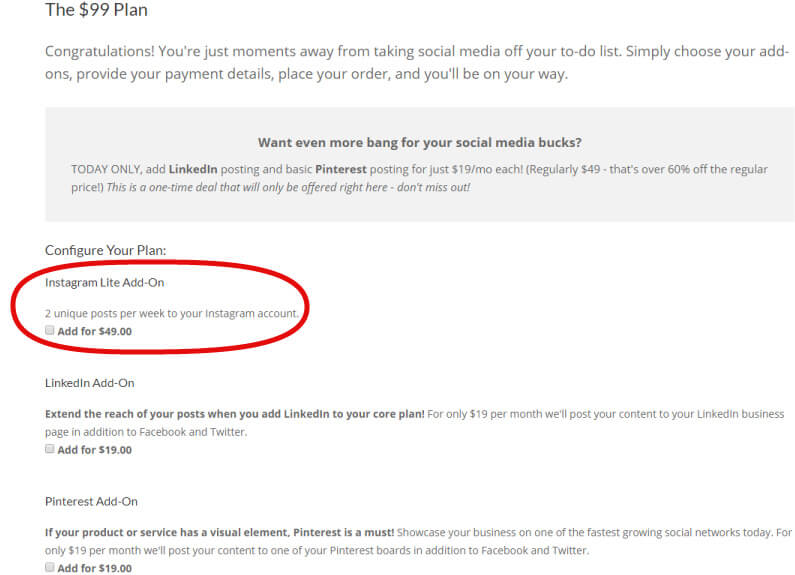
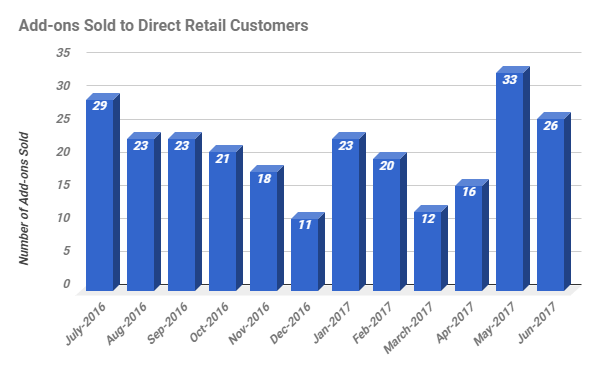
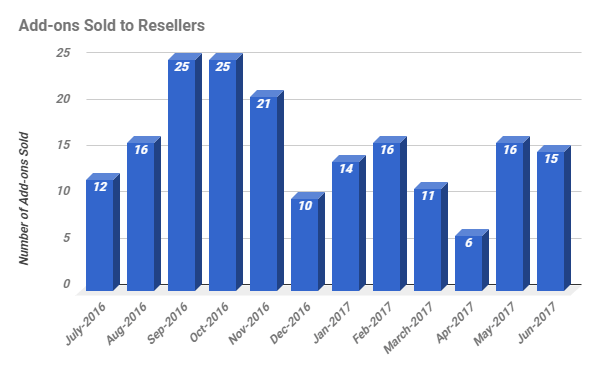
Besides higher-tier plans, we also encouraged customers to buy add-ons. For example, on the checkout page, we recently replaced the Google+ add-on ($19) with Instagram ($49).
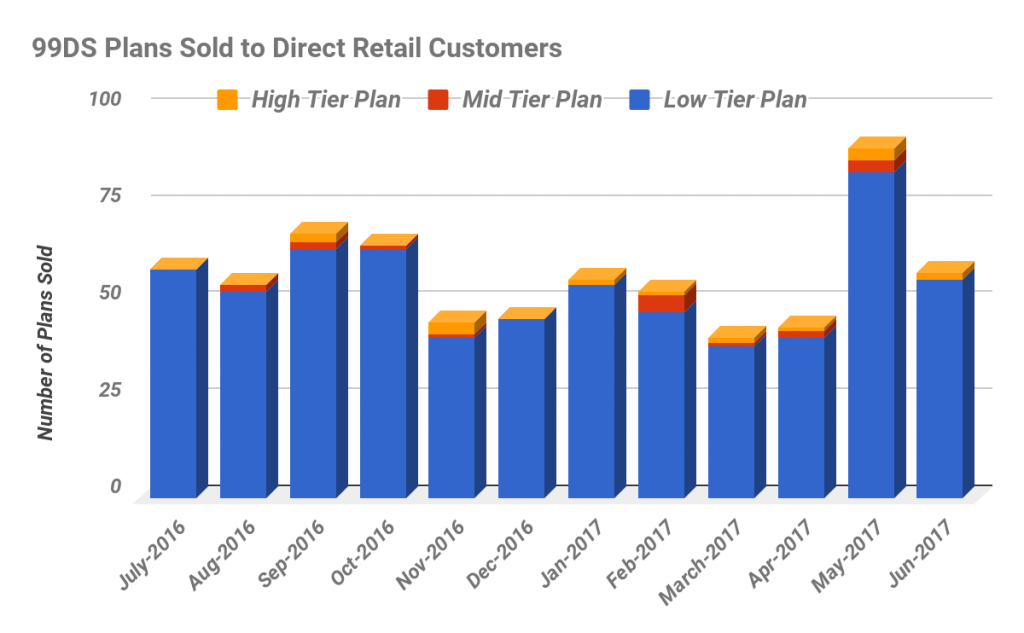
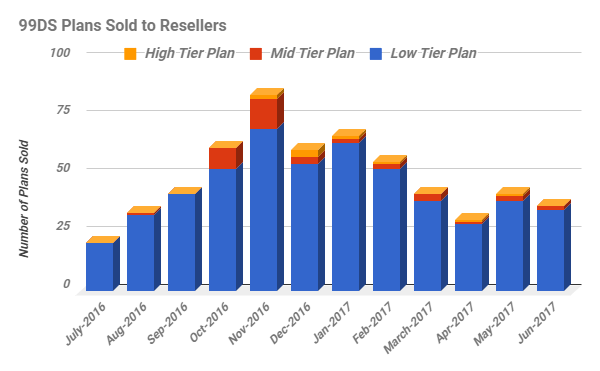
Here’s our signups from 1 July 2016 to 1 July 2017. Although the low tier plan accounted for the majority of our signups, we planned to focus on the mid/high tiers and add-ons moving forward.
IV. Reducing Churn

What is Churn Rate?
Churn rate refers to the proportion of subscribers who cancel during a given time period. The churn reports below display net churn or the overall loss of subscribers or members for the selected product(s).
Companies with high churn rates had to constantly look for new customers to replace those who canceled. So reducing churn was a priority for us.
To reduce churn, we worked on improving our processes and systems and thus, the customer experience.
Ensuring All Posts Got Published on Time
We switched our posting platform from Sendible to Social Report in May 2017.
This was because the Sendible platform would go down every now and we had to issue refunds as a consequence.
Besides higher reliability, the new platform had the added advantage of better reporting.
Improving Our Onboarding Process
We gave everyone who signed up a welcome call within 24h to follow up on all the details needed for their social media postings and to address any potential questions.
During these calls, we gave our customers more information on the results to expect and the services we offered.
Since Jan 2017, we also implemented an onboarding email campaign. We expanded from the previous 3-4 emails sent in the first month to 7 emails.
Raising the Calibre of Our Team
We trained our content specialists to produce higher quality social media posts.
We also moved towards a consultant approach i.e. we talked to customers to find out their needs and sold them based on the problems they wanted to solve.
The Results
Unlike other metrics, the lower the churn rate, the better. Unfortunately, our churn rates for both direct retail customers and resellers didn’t see much improvement.
This was because we focused on aggressive growth strategies instead of maximizing/nurturing our existing clientele. We would need to work on this moving forward.
Below you’d find the charts of our churn rates. The churn rates were calculated by dividing the number of customers who churned by the number of customers at the start of each period.
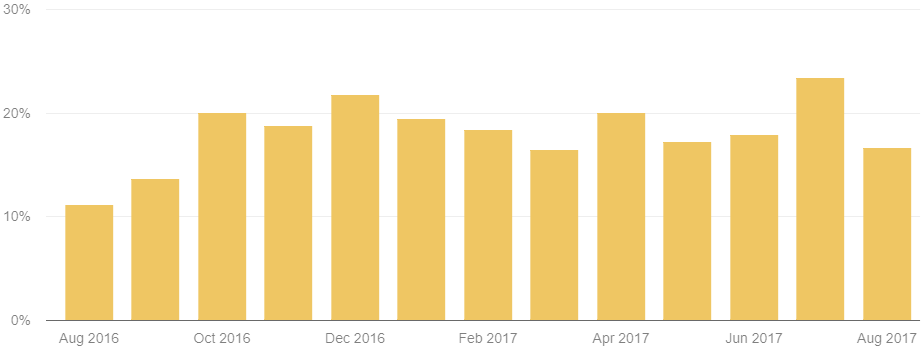
Churn Rate of Direct Retail Customers
The churn rate of direct retail customers was 11.1% in Aug 2016 and 16.6% in Aug 2017.
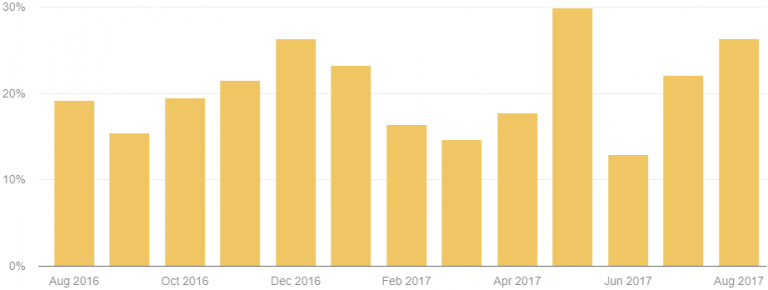
Churn Rate of Resellers
The churn rate of resellers was 19.1% in Aug 2016 and 26.2% in Aug 2017.
V. Running Paid Ads on Facebook
We did tons of Facebook ad tests over the last 3-4 months and came up with a finely tuned machine. And we made use of Facebook’s lookalike audience and advertised to this segment.
Looking at the screenshot below, you might be thinking “isn’t your cost per purchase a tad high?” Yes, at an average cost of $185 per purchase, our cost was rather high…
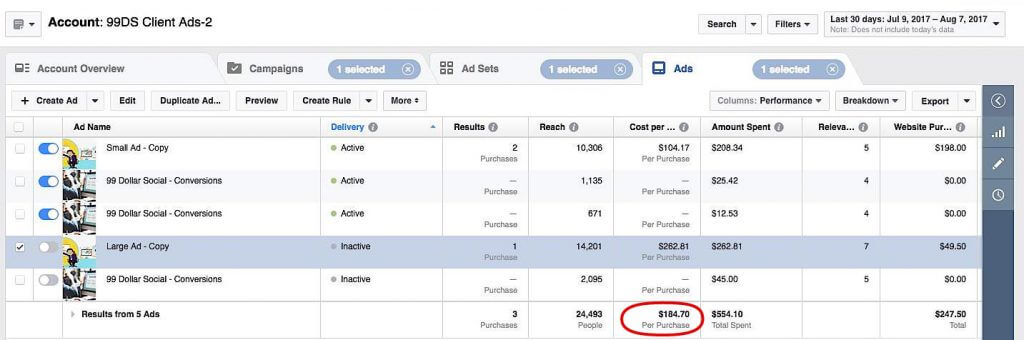
…but this was still lower than our customer lifetime value. Which meant we still came up tops. For every customer we got via Facebook ads, we still made a profit.
Our Facebook ads led to various landing pages. For example, for the last 2-3 months, we experimented with a 14-day trial, which had a trial to conversion ratio around 20%.
From 1 May to 17 July 2017, we spent $10,656. But we only got 16 active customers from this landing page so we would consider this a fail in terms of ROI.

Moving on, another experiment we ran was offering the first month at 50% off (not enough data at the time of writing to be conclusive).

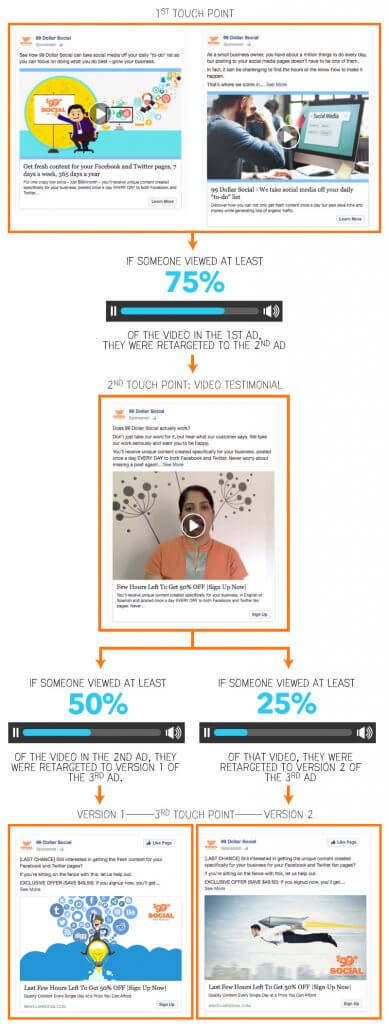
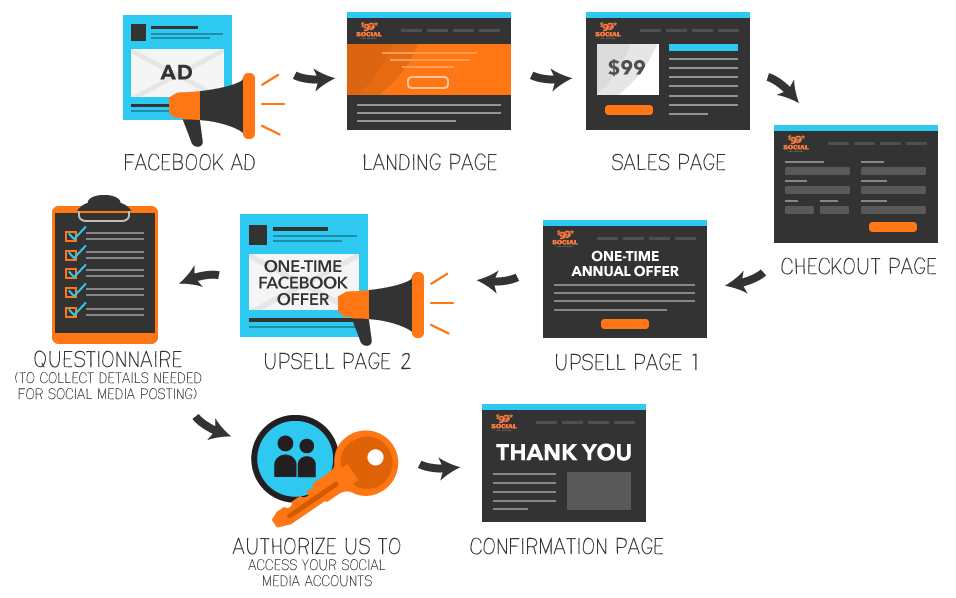
Our Facebook funnel had 2 upsells built-in, here’s how it worked:
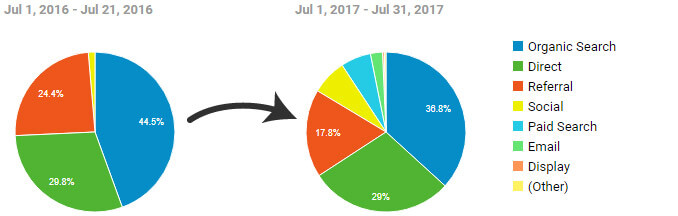
Thanks to our paid Facebook ads, the composition of our top traffic channels changed. Social went from 1.4% of our traffic in July 2016 to 7.1% in July 2017.
VI. Experimenting with Push Notifications
Push notifications was something new we wanted to experiment with to complement our email marketing efforts.
For all visitors who went to our website, we added a push notification to ask them to join our webinars or offered them coupon codes for discounted purchases.
As a visitor, you’d see a Get Offers tab on the right:
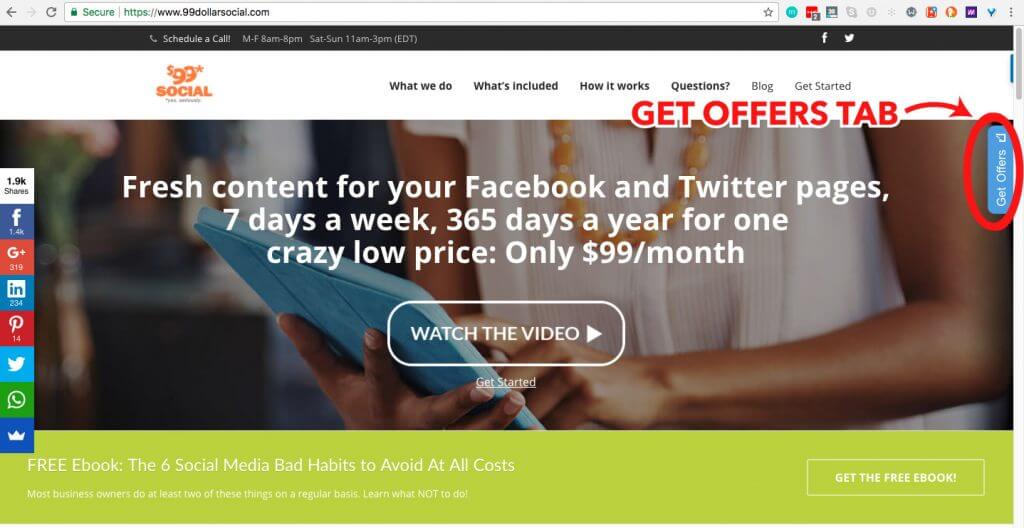
If you clicked on that, you’d see this popup:
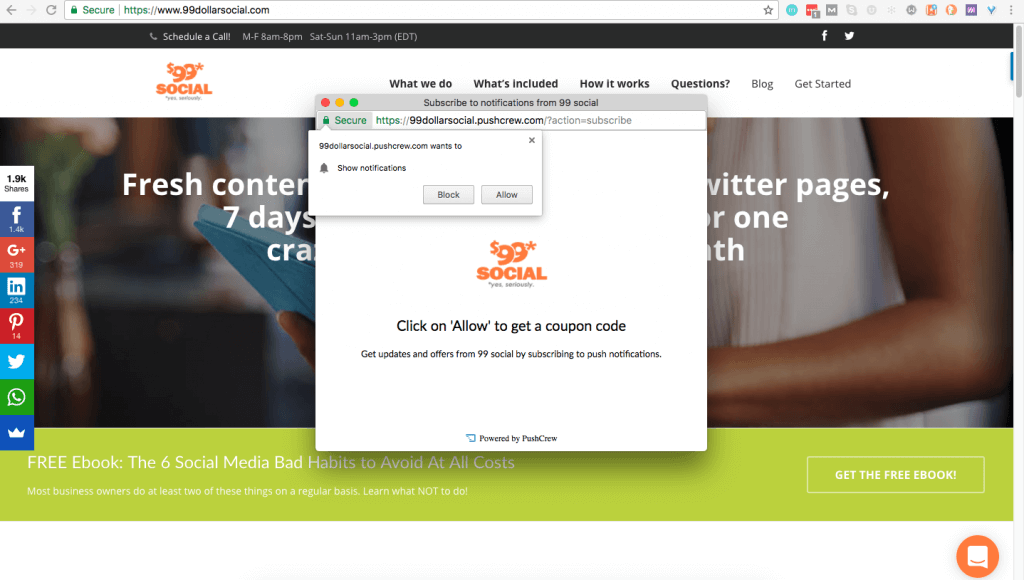
Here are some examples of the various notifications we tried and their click rates.
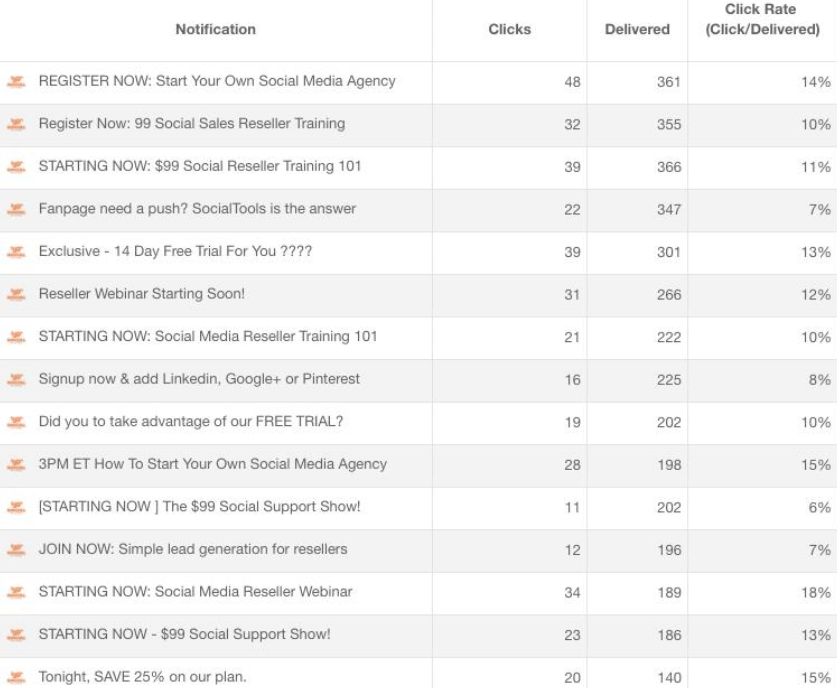
We started running push notifications in Jan 2017 and added 706 subscribers as of the time of writing.
Conclusion: We saw this a nice-to-have bonus but not a major game-changer to our business.
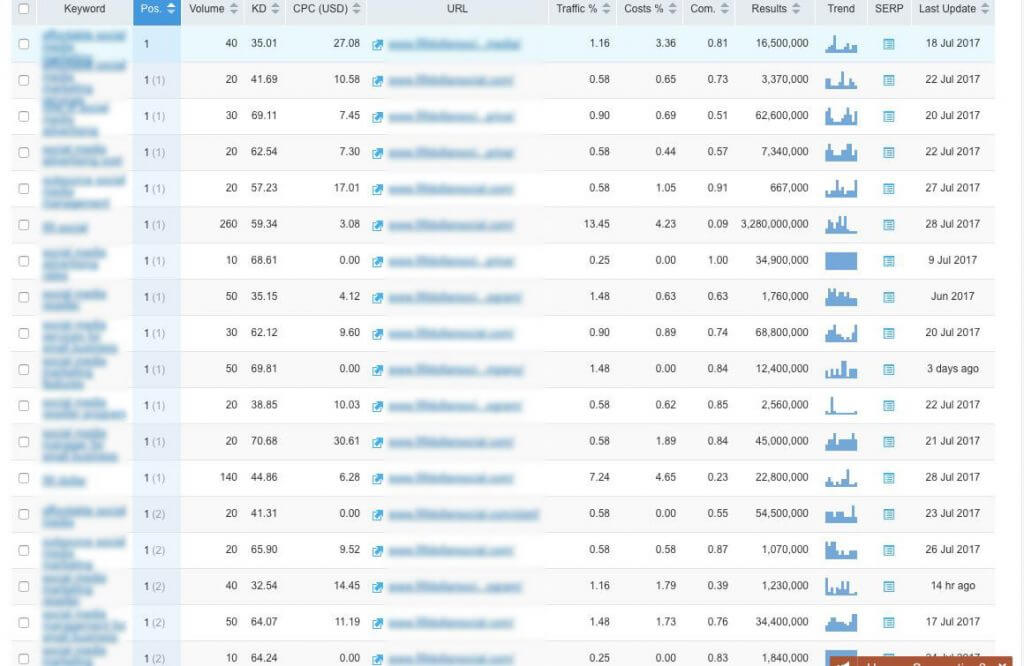
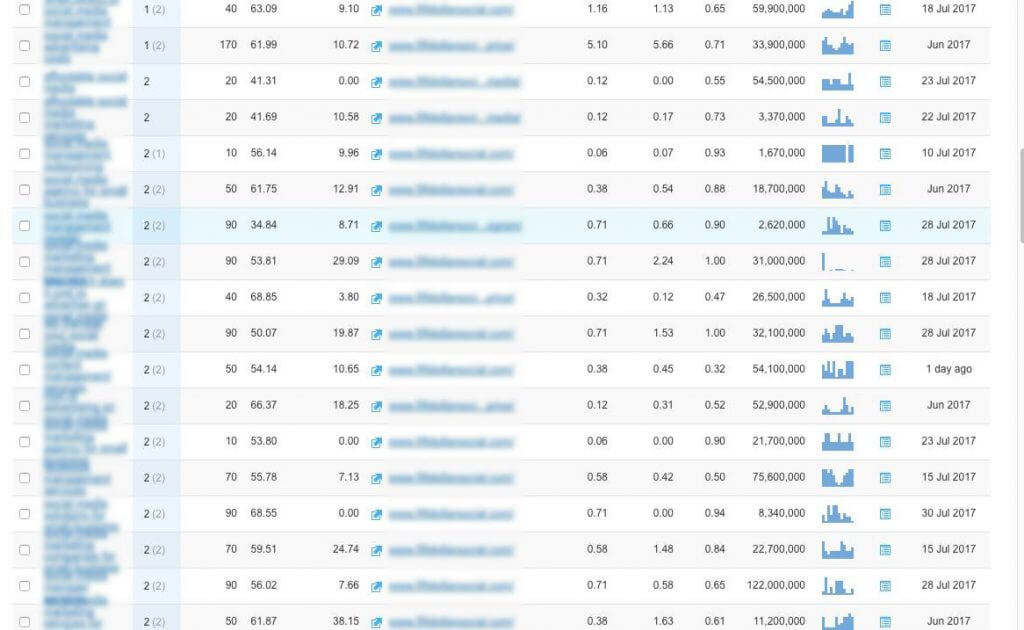
VII. Creating Content and Link Building
Unlike the publisher sites in our portfolio, we focused less on content and link building.
Since we bought this site, we created approx 10 pieces of articles per month and guests posted between 5-10 articles per month.
This resulted in us ranking for about 2000 keywords as of the time of writing, up from about 1000 keywords when we just bought the site.
In other words, we doubled the number of keywords we ranked for.
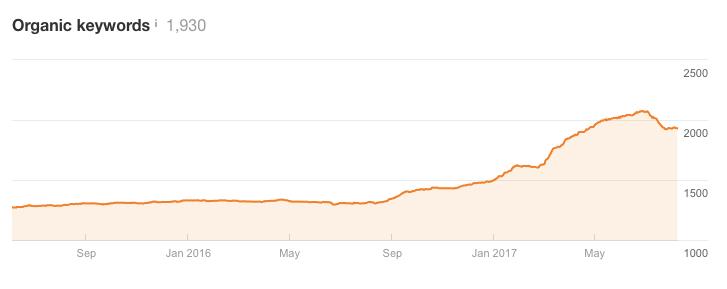
We ranked in the top 2 positions for about 206 money keywords.
The Results
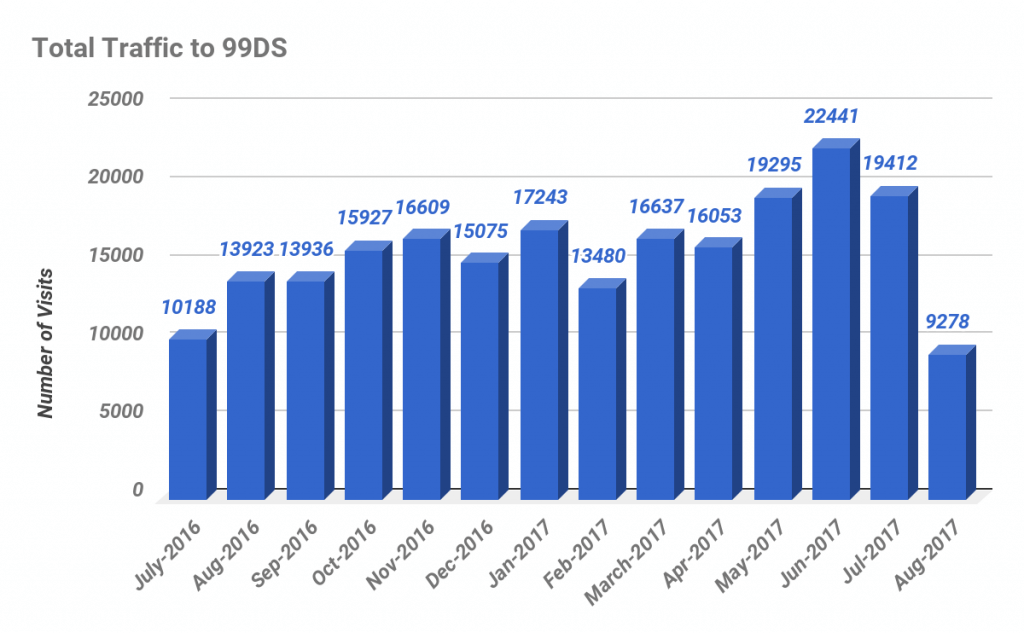
Thanks to the above efforts, here are our results in terms of traffic, number of customers, revenue and lifetime value.
Traffic
We increased traffic by 1.9x from 10,188 in July 2016 to 19,412 in July 2017.
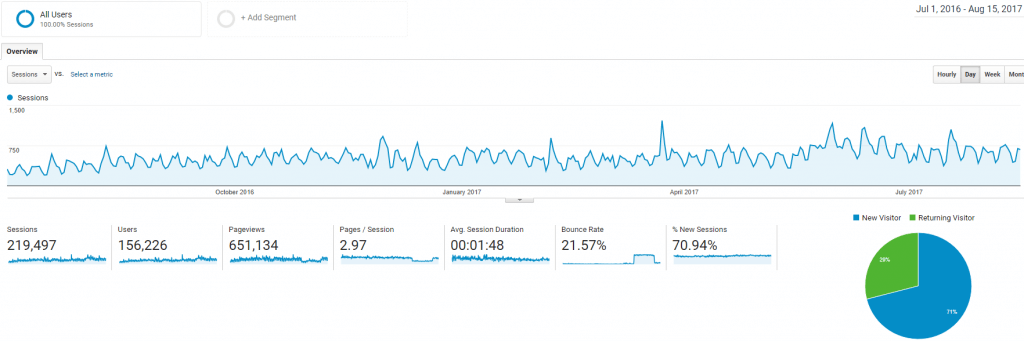
Note: The traffic figure for Aug 2017 was lower because the month was incomplete when this case study was written.
Number of Customers
As of the time of writing, we had 349 direct retail customers and 306 resellers. The big win for us was resellers, with a 1.7x increase in their numbers in the last 12 months.
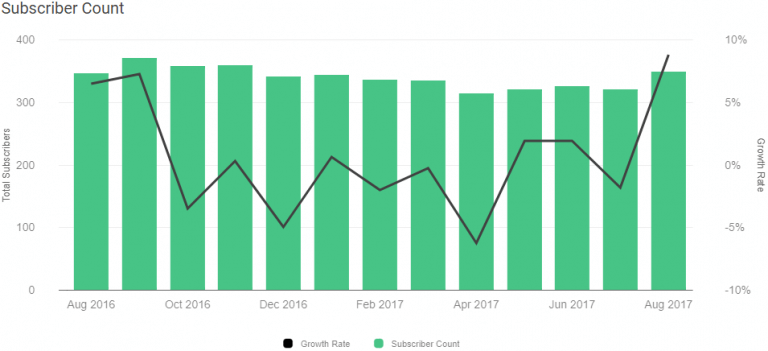
Note: The word “subscriber” in the charts below refers to customers.
Number of Customers: Direct Retail
The number of direct retail customers didn’t change significantly in the last 12 months. As of mid Aug 2017, we had 349 direct retail customers vs 346 in Aug 2016.
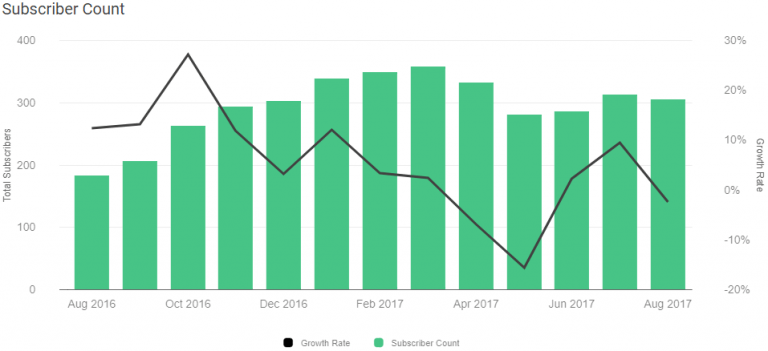
Number of Customers: Resellers
We experienced a 1.7x increase in the number of resellers, from 182 in Aug 2016 to 306 in mid-Aug 2017.
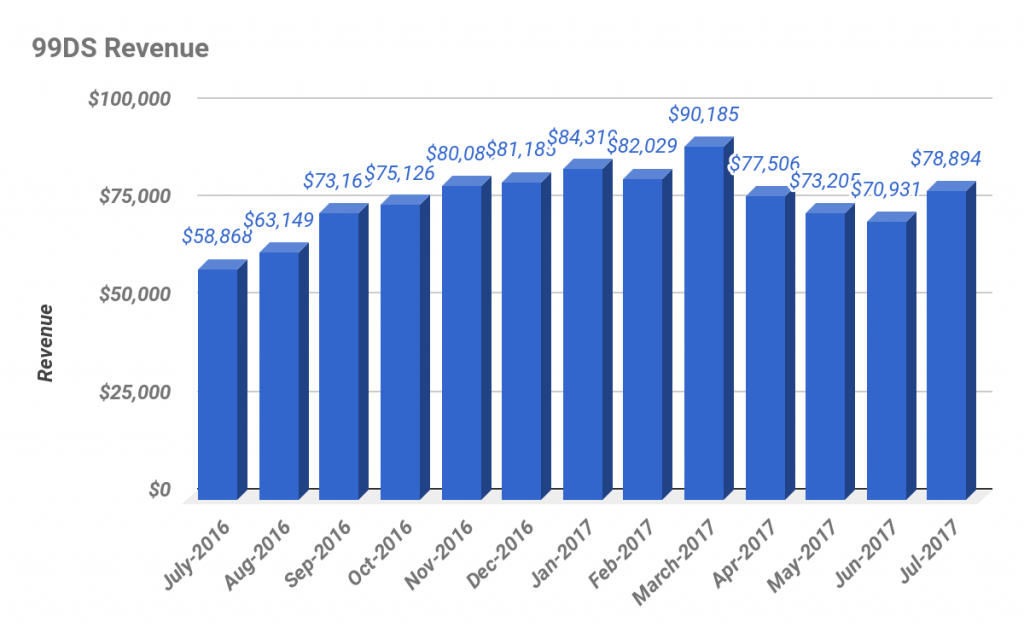
Revenue
We increased our revenue by 1.34x from $58,868 in July 2016 to $78,894 in July 2017.
Breaking it down further, we could see that the increase was due to resellers.
While revenue from direct retail customers hovered around $42k, revenue from resellers doubled in the last 12 months from $19,743 to $40,092.
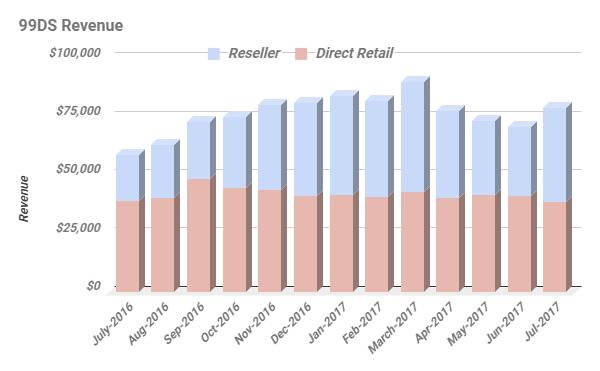
Note: Affiliate revenue not shown because it was too insignificant.
Next, let’s take a look at the monthly recurring revenues.

What is Monthly Recurring Revenue (MRR)?
MRR is a measure of a company’s expected monthly recurring revenue based on snapshots of its customer base. As customers sign up and upgrade, MRR goes up. As customers downgrade or churn, MRR goes down. For customers who pay monthly, the MRR is simply the amount paid each month for their subscriptions.
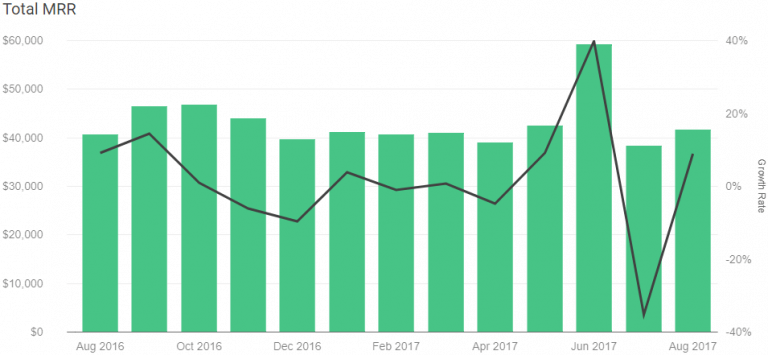
MRR for Direct Retail Customers
The MRR was $41,889 in mid-Aug 2017, which was a 3.3% increase from $40,548 in Aug 2016.
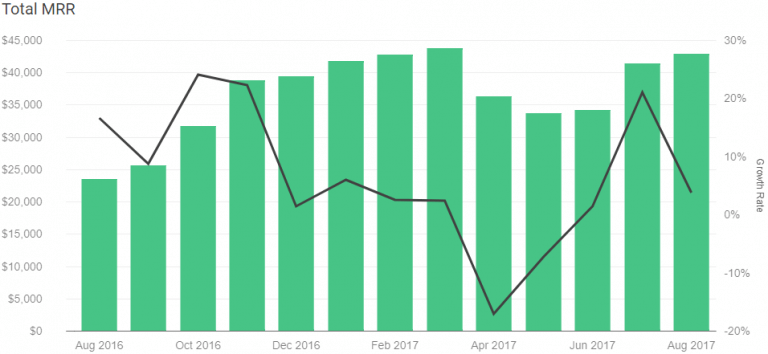
MRR for Resellers
The MRR was $43,066 in mid-Aug 2017, which was a 1.8x increase from $23,526 in Aug 2016.
Customer Lifetime Value

What is Lifetime Value (LTV)?
A customer’s LTV is a prediction of the net profit attributed to the entire future relationship with a customer. It’s often used as an indicator of how much can be spent to acquire each customer.
Prior to the acquisition, the LTV of a customer was around $260-270. A reseller would stay with us for about 3.7 months and a direct retail customer for about 3 months.
Post-acquisition, the LTVs of both direct retail customers and resellers increased.
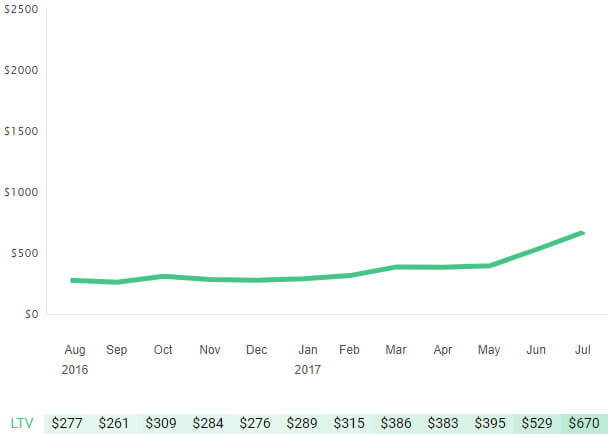
Lifetime Value of a Direct Retail Customer
The LTV of direct retail customers increased from $277 in Aug 2016 to $670 in July 2017.
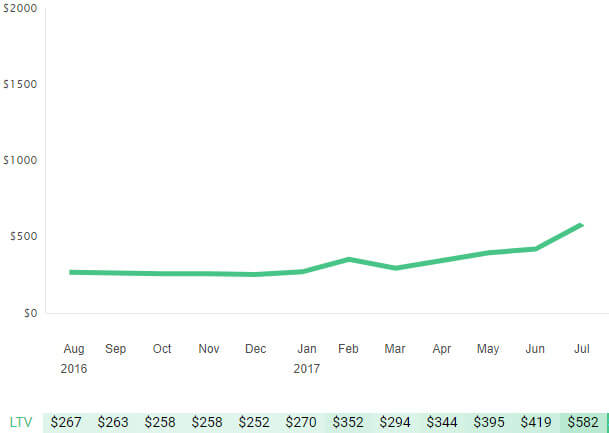
Lifetime Value of a Reseller
The LTV of resellers increased from $267 in Aug 2016 to $582 in July 2017.
Bottom Line
We bought the site in July 2016 and managed to achieve the following in the last 12 months:
2x
the revenue from resellers
2x
the number of keywords we ranked for
1.9x
the monthly traffic
1.7x
the number of resellers
The site is now earning $79k/mo.
Here’s what we did:
- Further monetizing our reseller program via webinars
- Maximizing our existing affiliates’ lists
- Upselling to higher-tier plans
- Reducing churn
- Running paid ads on Facebook
- Experimenting with push notifications
- Creating content and link building
Moving forward, we’ll focus on the following:
- Do bigger joint ventures with resellers who have 50+ clients
- Hone our Facebook ad funnels for direct retail customers, then replicate for resellers
- Use webinars as a sales tool with other partners/affiliates
- Do more link building to increase our organic search traffic
- Reduce churn to <5% via better customer service and product improvement
- Split test pricing
Our long term goal is to 4x the earnings in 3 years and exit the business after realizing those gains.
We’re always on the lookout for good businesses that want to be great, and we’ve got the experience and infrastructure to create a custom team of fulltime and freelance experts to improve businesses. You’ve built it and brought it this far; if you want to grow, let us help you take it to the next level. If you think you have a great business and need a partner, contact us.
If you’re looking to purchase high-end online businesses, filter out small deals and work with one of the best teams in the world, look no further. We specialize in high-end deals only to make sure that our time isn’t spent on smaller transactions, meaning that each of our deals is a lot more important to us than it would be to other brokers.